Lux Injectables SEO Case Study

Lux Injectables
SEO Case Study
Lux Injectables had a big following on Instagram but needed help establishing their presence online. After having EDNA build their website, they started Search Engine Optimization from Day 1 and have seen tremendous growth since then.
Goals
- Rank website on the first page of Google for selected keywords
- Increase Engagement and Visibility
- 20-40% Lead Generation (combo of both GBP calls + onsite conversions (forms/calls depending on the tracking setup)
Action Plan
- Extensive keyword research to find relevant keywords including competitive analysis
- Optimize GMB profile from top to bottom
- Built relevant niche and local citations
- Optimized onsite for location signals
- Post weekly on their GMB profile to increase additional signals
- Evaluate the site's content silo for content strategy
- Create and publish monthly blogs as supplementary content for target keywords
Prior to working with EDNA, Lux Injectables was getting the following results
UA: User Acquisition
Date Range: February 2022 - March 2023
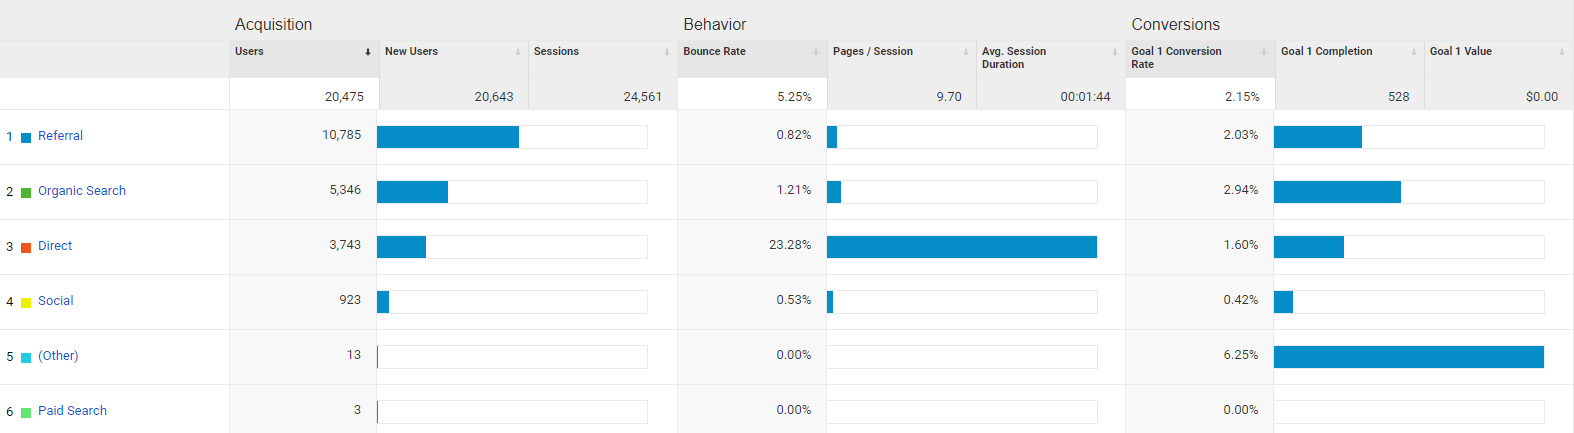
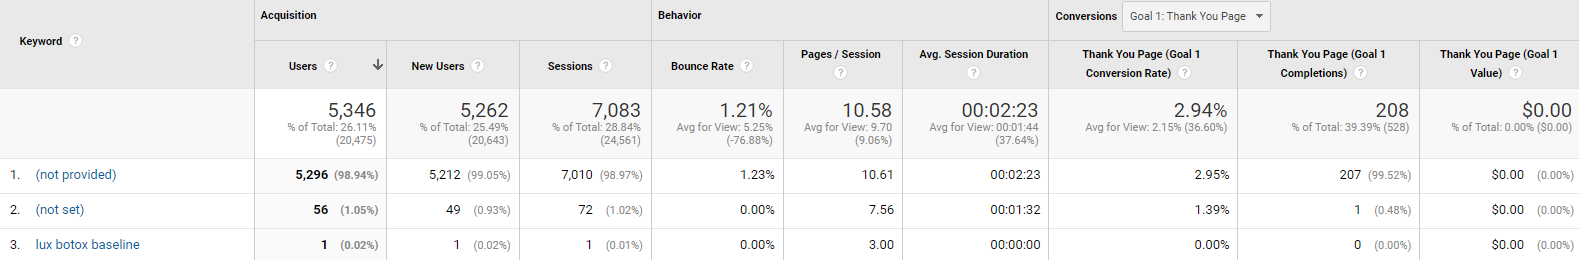
Here are the user acquisition metrics for the client's website as measured in Universal Analytics (UA). As seen, organic search brings the second highest number of new users to the website in February 2022 - March 2023. Out of 20,643 new users, organic search contributed 25.49% of the total new users.
Campaign Results
- New Users: New users from organic search from 5,262 users in February 2022 - March 2023 to 8,744 users in April 2023 - May 2024,
an increase of 66.19%
- Website Traffic: Out of 18,446 users and 22,481 sessions, organic search contributed to
47.40% of the users and 51.31% of the sessions
- Sessions from Organic Search, an increase of 62.84%
COMPARISON (User Acquisition)
Date Range: April 2023 - May 2024 vs. February 2022 - March 2023
If we compare how our strategy improved, we can see an improvement in user acquisition metrics. New users from organic search increased by 64.77% in April 2023 - May 2024 as compared to new users recorded in February 2022 - March 2023.
GA4: Traffic Acquisition
Date Range: April 2023 - May 2024
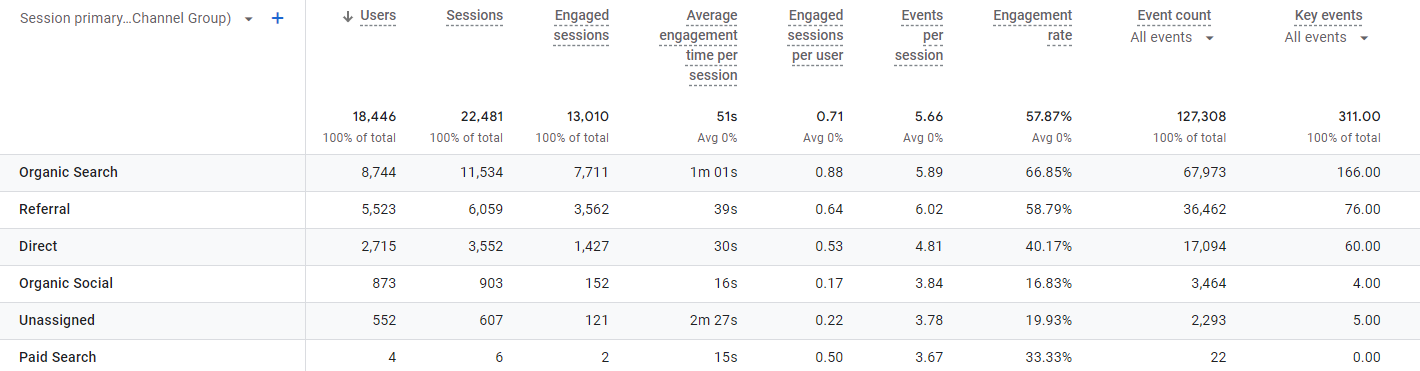
Here are the traffic acquisition metrics for the client's website as measured in Google Analytics 4 (GA4). Similar to the acquisition metrics, organic search is the channel that brings the highest number of users and sessions to the website in April 2023 - May 2024. Out of 18,446 users and 22,481 sessions, organic search contributed to 47.40% of the users and 51.31% of the sessions, respectively.
COMPARISON (Traffic Acquisition)
Date Range: April 2023 - May 2024 vs. February 2022 - March 2023
If we compare how our strategy improved, we can see an improvement in traffic acquisition metrics.
Users from organic search increased by 63.56% in April 2023 - May 2024 as compared to users recorded in February 2022 - March 2023.
Additionally, sessions from organic search increased by 62.84% in April 2023 - May 2024 as compared to sessions recorded in February 2022 - March 2023.
Google Search Console
Date Range: February 2023 - May 2024
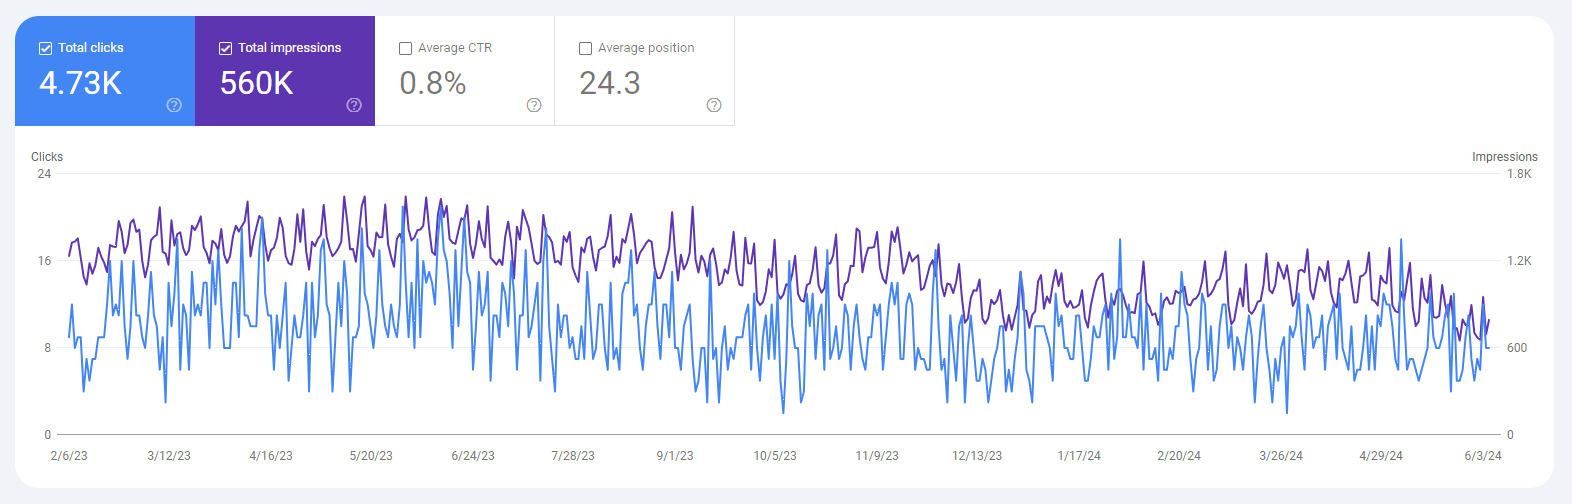
Google Search Console only provides 16 months worth of data. Here is the performance of the client for February 2023 - May 2024. The website has 4.73 clicks, 560K impressions, 0.8% average click-through rate, and 24.3 average position.